
The headline dental tourism statistics, in one table
These are the load-bearing numbers — the ones worth quoting in a board deck or an article, each with its source. Notes on reliability follow in the methodology section, because a statistics page that hides its error bars is marketing, not data.
| Statistic | Figure | Source |
|---|---|---|
| Americans traveling abroad for dental care, 2025 (projected) | 850,000+ | Dentaly |
| Same figure, 2024 | ~780,000 | Dentaly |
| Americans traveling to Mexico for medical purposes, per year (upper estimate) | up to 3,000,000 | Dentaly |
| Price gap on dental implants, Mexico/Turkey vs. US | 60–80% cheaper | Dentaly |
| Typical savings per treatment trip | $5,000–15,000 | Dentaly |
| US inbound medical-travel volume, per year (range across sources) | ~450,000–1.9M | Grand View Research · Market.us · Medical Tourism Magazine |
| Share of US inbound market held by the South (FL · TX) | 31% | Grand View Research |
| Overseas patients treated in London, per year | 100,000+ | The National · NIH/NCBI |
| Australia inbound medical-travel market, 2025 | ~USD 445M | IMARC · Bonafide Research* |
| International patients treated in Korea, 2025 | 2,010,000 | Korean Ministry of Health and Welfare |
*Research-firm projection with an optimistic 25% CAGR forecast attached — treat the growth rate as a vendor estimate, not observed data. All sources linked in full at the end of this page.
Outbound: 850,000 Americans, and why the number keeps climbing
Dentaly's industry analysis projects more than 850,000 Americans traveling abroad for dental care in 2025, up from roughly 780,000 in 2024 — about 9% growth in a single year. Zoom out from dental to all medical purposes and the flow gets larger still: estimates of Americans crossing into Mexico for medical care run as high as 3 million per year.
The driver is arithmetic, not adventure. With implants and full-arch restorations priced 60–80% lower in Mexico and Turkey, a patient facing a five-figure US treatment plan can save $5,000–15,000 on one trip — enough to cover flights and hotels several times over. That is why the outbound flow skews toward exactly the high-ticket restorative cases that anchor a US practice's production: the bigger the treatment plan, the more rational the flight becomes.
None of the structural inputs are weakening: US fee schedules are not falling, insurance coverage for major restorative work remains thin, and destination industries keep getting better at packaging the trip. For a practice owner, the projection to plan against is more patients researching the option every year — not fewer.
Where they go: Mexico, Turkey, and the packaged-trip industry
Mexico is the volume destination, on pure geography. Border clinic clusters — the best known sitting directly across from Yuma, Arizona — exist almost entirely to serve American dental patients, and the up-to-3-million annual medical-travel estimate (Dentaly) makes the corridor the largest in the world of its kind.
Turkey is the fast riser on the long-haul side. Axios has documented how Istanbul built a packaged medical-travel industry around hair transplants, cosmetic procedures, and dentistry — flights, hotels, transfers, and treatment bundled into a single price, marketed directly to Americans on social platforms. The packaging matters as much as the price: it removes the planning friction that used to keep hesitant patients home. Costa Rica, Hungary, and Thailand round out the destination lists that recur across industry analyses.
What the destination industries understand — and most local practices do not — is that the battle is fought at the research stage. Destination clinics publish relentlessly: prices, procedures, recovery timelines, travel logistics. When a patient searches or asks an AI engine about implant costs, that is the content which gets retrieved and cited. The supply side of dental tourism is, above all, a content operation.
The other direction: inbound numbers worth knowing
Medical travel is not a one-way drain — and the inbound figures are useful context for any clinic weighing international patients as a growth line. In the US, inbound estimates span roughly 450,000 to 1.9 million patients a year depending on source and definition, concentrated in complex care at major academic centers; the South (Florida, Texas) holds 31% of the market, helped by Latin American proximity and bilingual capacity (Grand View Research).
The UK has the strongest small-clinic inbound story: London treats 100,000+ overseas patients a year, concentrated in the self-pay market around Harley Street, with Gulf-state governments funding treatment abroad (The National; NIH/NCBI). Australia's inbound market is the smallest of the three at roughly USD 445 million in 2025 (IMARC — with the vendor's optimistic growth forecast noted above). And Korea — the market we operate in — logged 2.01 million international patients in 2025 by the health ministry's count, making it the densest medical-travel competition in the world.
If your interest is the inbound side rather than defense, start with our honest segment-by-segment read in how to attract international patients.
How patients research it now: the AI-answer layer
The statistics above describe who travels. The newer shift is how they decide. Gartner's widely cited forecast has traditional search volume falling 25% by 2026 as AI answer engines absorb research queries — and dental tourism is a textbook answer-engine topic, because the patient's real question is comparative: "Is it safe to get implants in Mexico, or should I stay local? What does revision cost if it goes wrong?"
Ask ChatGPT, Gemini, or Google's AI Overview those questions today and the retrieved sources are overwhelmingly dental-tourism content — destination clinics and facilitator platforms — because they publish and most local practices do not. The answer a patient receives is assembled from whoever wrote one. The mechanics of that assembly — retrieval, entity data, structured markup, corroboration — are published in full in our guide to how AI recommends clinics, and the broader numbers behind the channel shift are collected in AI search statistics for healthcare.
What the numbers mean for a US practice — the win-back read
Read as a practice owner, the dataset reduces to three sentences. You cannot win on price: a 60–80% gap is not a discount problem, and matching it would break your fee schedule. You can win on everything price doesn't cover: continuity of care, revision risk and who bears it, accountability under your state's standards, and the value of a dentist who will still be there in five years — the exact trade-offs an honest comparison surfaces. And you can only win if you are present at the research moment: the patient weighing Yuma against your chair has to find your answer before the flight is booked — in Google, in the AI answer, and in Spanish as well as English where your community requires it (our Spanish SEO for dentists guide covers that flank).
The full strategy — positioning, content plan, and the compliance guardrails — lives in our dedicated playbook: compete with dental tourism. This page is the evidence base; that page is the plan.
On engagement terms, the model is the same one we run everywhere: $0 upfront — a flat 20% of revenue from the patient lines you assign to us, CRM-verified, with no per-patient counting, the exact base designed around your practice during the free audit. Four terms always travel with the 20%: $0 upfront · non-exclusive · cancel anytime · monthly CRM settlement. For price context, typical healthcare marketing retainers run $2,500–10,000 a month regardless of results (Healthcare Success) — the full benchmark breakdown is in healthcare marketing agency cost.
Methodology: why the estimates vary, and how to cite this page
No border agency records "dental trip" as a travel purpose, so every volume figure in dental tourism is a modeled estimate — built from surveys, clinic-side data, and travel patterns. That is why serious sources can put US inbound medical travel anywhere from 450,000 to 1.9 million a year: the definitions differ (all medical purposes vs. planned treatment; patients vs. trips), and so do the incentives of who is counting. Our rules on this page: every figure is attributed inline, research-firm projections are flagged as such, and where sources disagree we show the range rather than picking the flattering end.
You are welcome to cite this page — journalists and researchers regularly need consolidated numbers, and that is what it is for. Please attribute figures to their original sources (all linked below) and link this page for the consolidated view. The dataset is reviewed when major sources update.
Who compiled this — and why trust the compilers?
HEIM GLOBAL runs international patient marketing from inside the world's densest medical-travel market: Seoul, 2.01 million international patients in 2025. We compile data like this because our work depends on reading it correctly — and because published, sourced analysis is how we prove competence before anyone books a call. The operation behind the analysis:
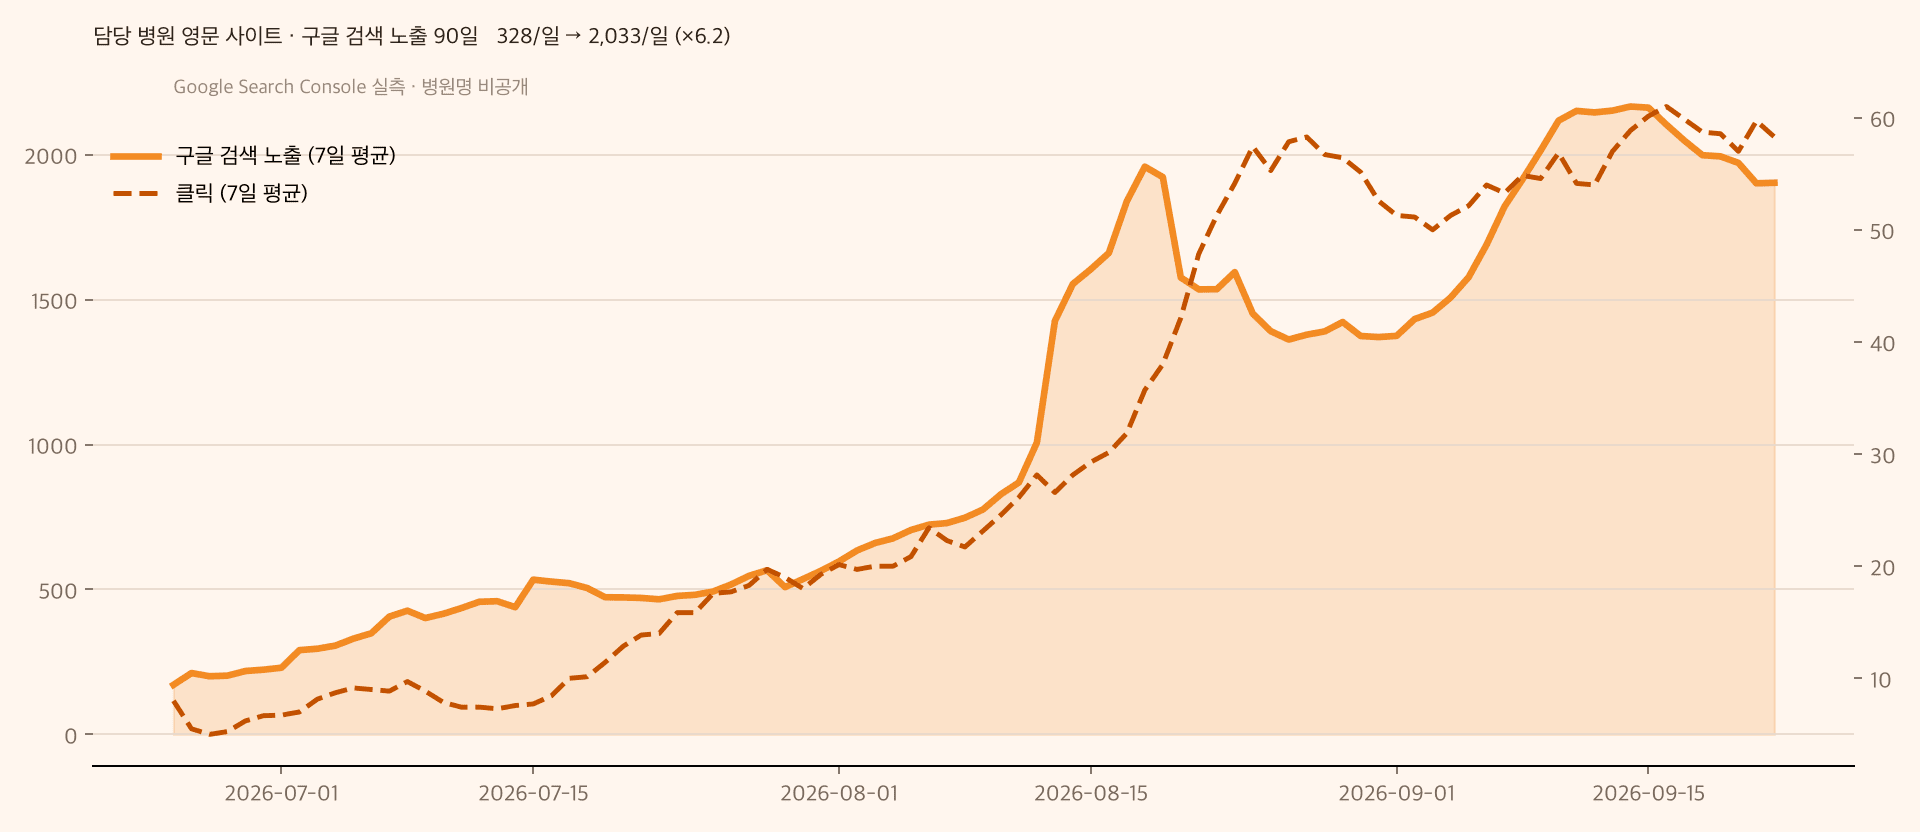
*Basis: internal CRM data from two Seoul dermatology clinics — foreign-patient revenue in the language lines we managed, versus the prior 12-month baseline; individual results vary with specialty, location, and competition. Clinic names withheld under NDA — full-screen walkthrough of live dashboards on the call.
'/%3E%3C/svg%3E)